GpxPlot software is a project to:
- Display GPS tracks in 3D (from .gpx files)
- edit them (cutting a link, moving or removing a point, merge tracks, edit waypoints…)
- Display a digital elevation model (DEM) for the map
- Display satellite/aerial images mapped onto the DEM
- Display OpenStreetMap vector data on the DEM (maybe also Mapnik-style OSM tiles)
GpxPlot is a follow-up of my OSM and SRTM data test using Python.
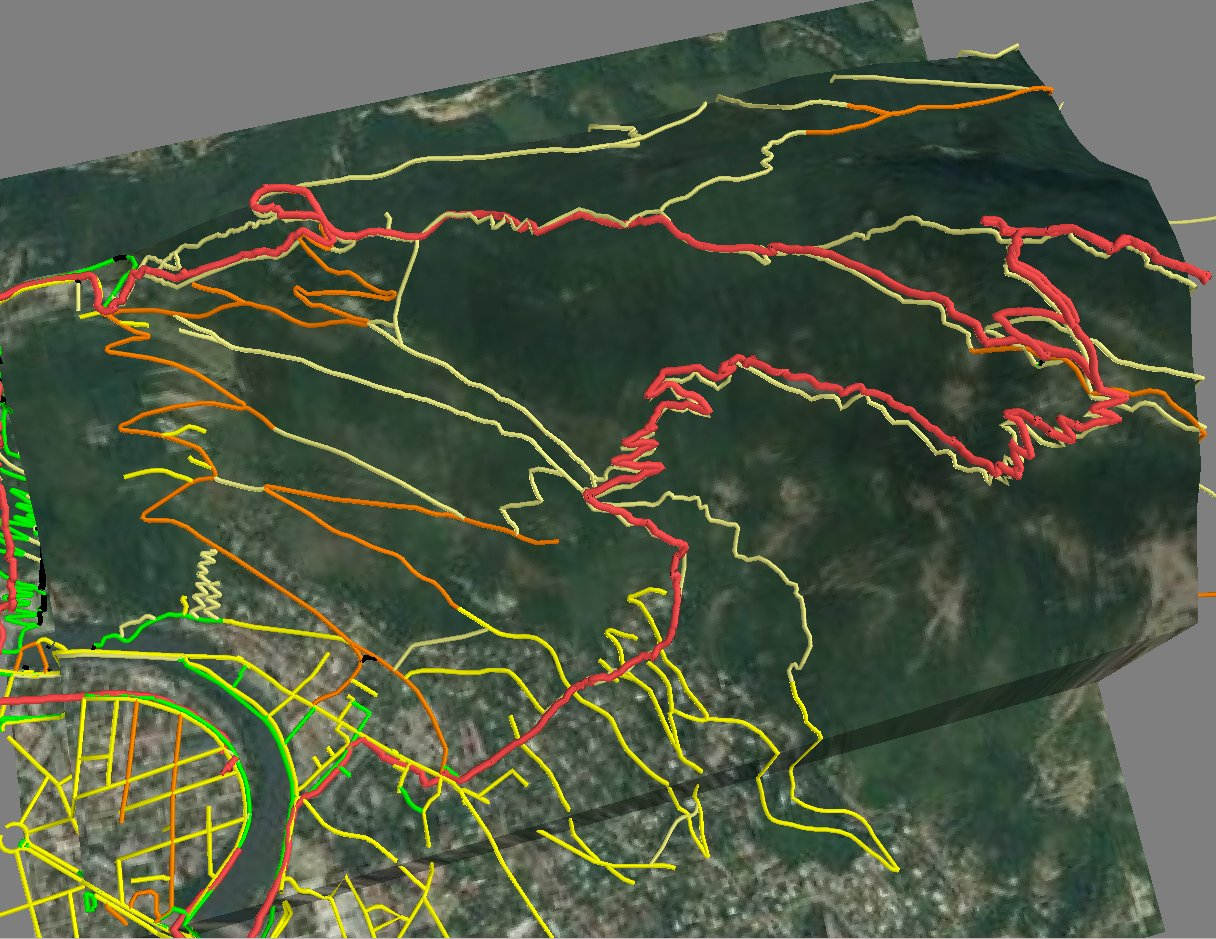
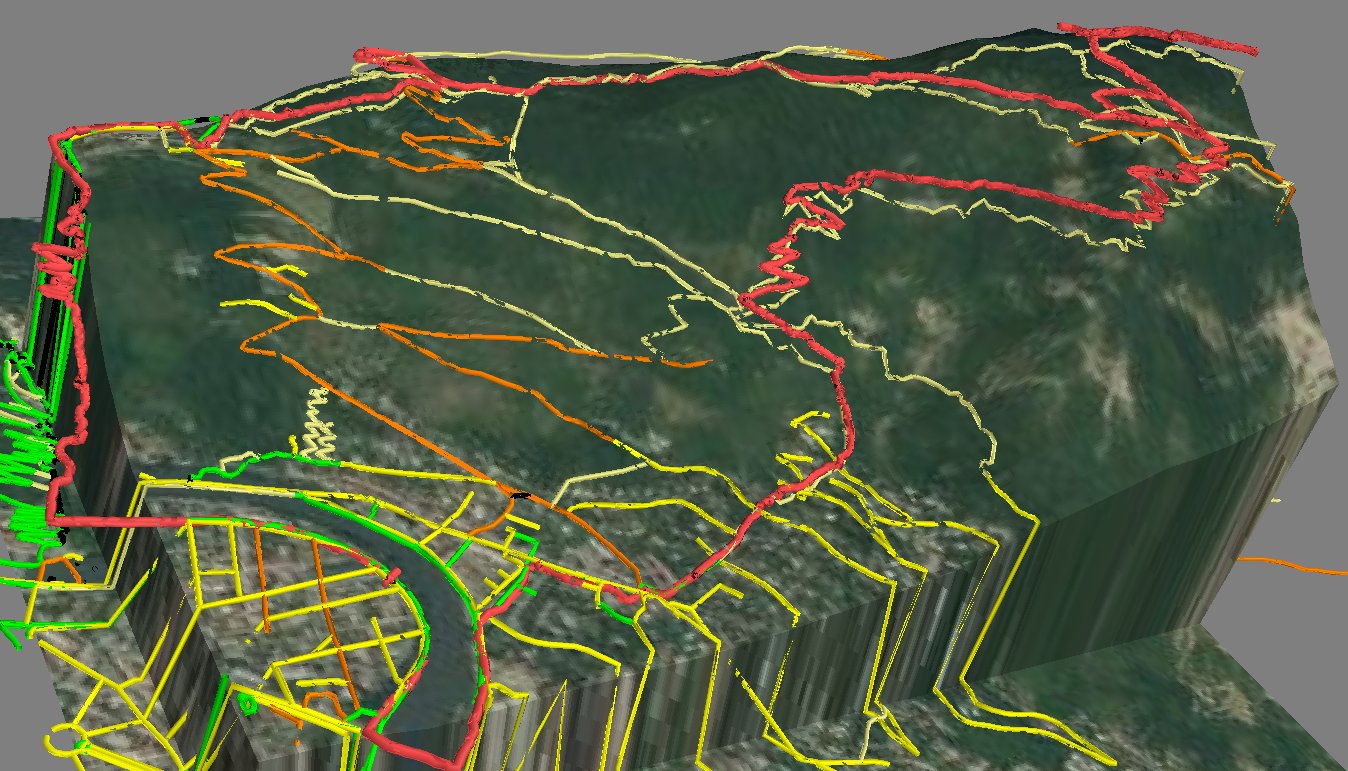
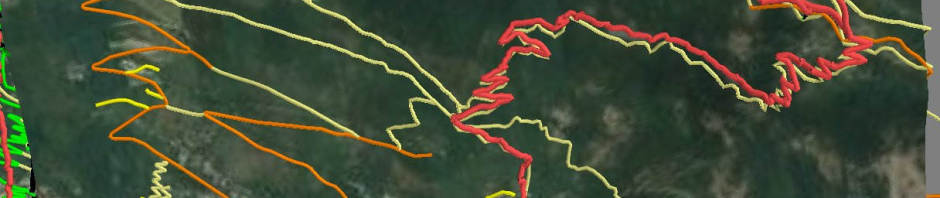
This is a 3D image of Mount Rachais (near Grenoble, France) including:
- 3D DEM from NASA SRTM data
- Satellite/aerial (Bing Maps) image mapped onto the surface, but larger. Altitude is 0 outside SRTM data; this explains the “walls” all around the 3D surface. There is still a bug that creates an offset between the image and the surface (look at the shape of the Isère river crossing the roads on the left)
- In red, a GPX track recorded while going up the moutain
- Other tracks are roads and paths from OpenStreetMap.
The tools used are not ideal yet (3D display is a little slow and not always easy to use…), but here they are:
Python, PyQt4 for the GUI, Mayavi Mlab for 3D display, gpxpy to read GPX files, OpenStreetMap Python API, Bing Maps API, SRTM data
Here’s hoping I will have some time to continue this, and add open data from the city and region, thanks to the work of the GreLibre groups for around Grenoble (hoping for better DEM and images…)

